· 9 min read · Node.js · Performance · Latency
Async/await waterfalls in Node.js: the bug that looks like clean code
Sequential awaits don't block the Node.js event loop. They add latency you never agreed to pay. How to find async/await waterfalls, and the fix that survives production.
Every Node.js service I have been handed to make faster has had the same bug somewhere in it, and it never looks like a bug. It looks like clean code.
const user = await getUser(userId)
const posts = await getPosts(user.id)
const events = await getEvents(user.id)
Three lines, readable, obviously correct. It is also three round-trips deep when it could be one, and at p99 that difference is the whole story.
That's an async/await waterfall. It turns up in every service I've been asked to speed up, it reads well, which is why it survives, and the fix is usually a two-line diff. This post covers why it costs more than the arithmetic suggests, how to fix it without making production more fragile, and how to find it.
Steal this. Compare your database's query time with your endpoint's total time on your slowest route. If the gap grows with the number of queries, you have a waterfall. For everyawaitthat reads a field off the previous result, ask whether the caller already had that value. Swap independent awaits forPromise.all, orPromise.allSettledwith a timeout per call when a partial page is acceptable. Check the connection pool size before you widen any fan-out. Watch p95 and p99, not the median.
Who this is not for: services whose slow path is CPU-bound work on the event loop. Parallelising I/O won't help you there, and the section on where this doesn't apply says what will.
What await actually costs
The common explanation is that await blocks the event loop. It does not, and it is worth being precise about this, because the wrong mental model leads to the wrong fix.
When a function hits await, it suspends and returns control to the event loop immediately. The loop is free to pick up other work: other requests, timers, I/O completions. Nothing is blocked. What await does is order your work: the second query cannot be issued until the first has resolved, because you told it so.
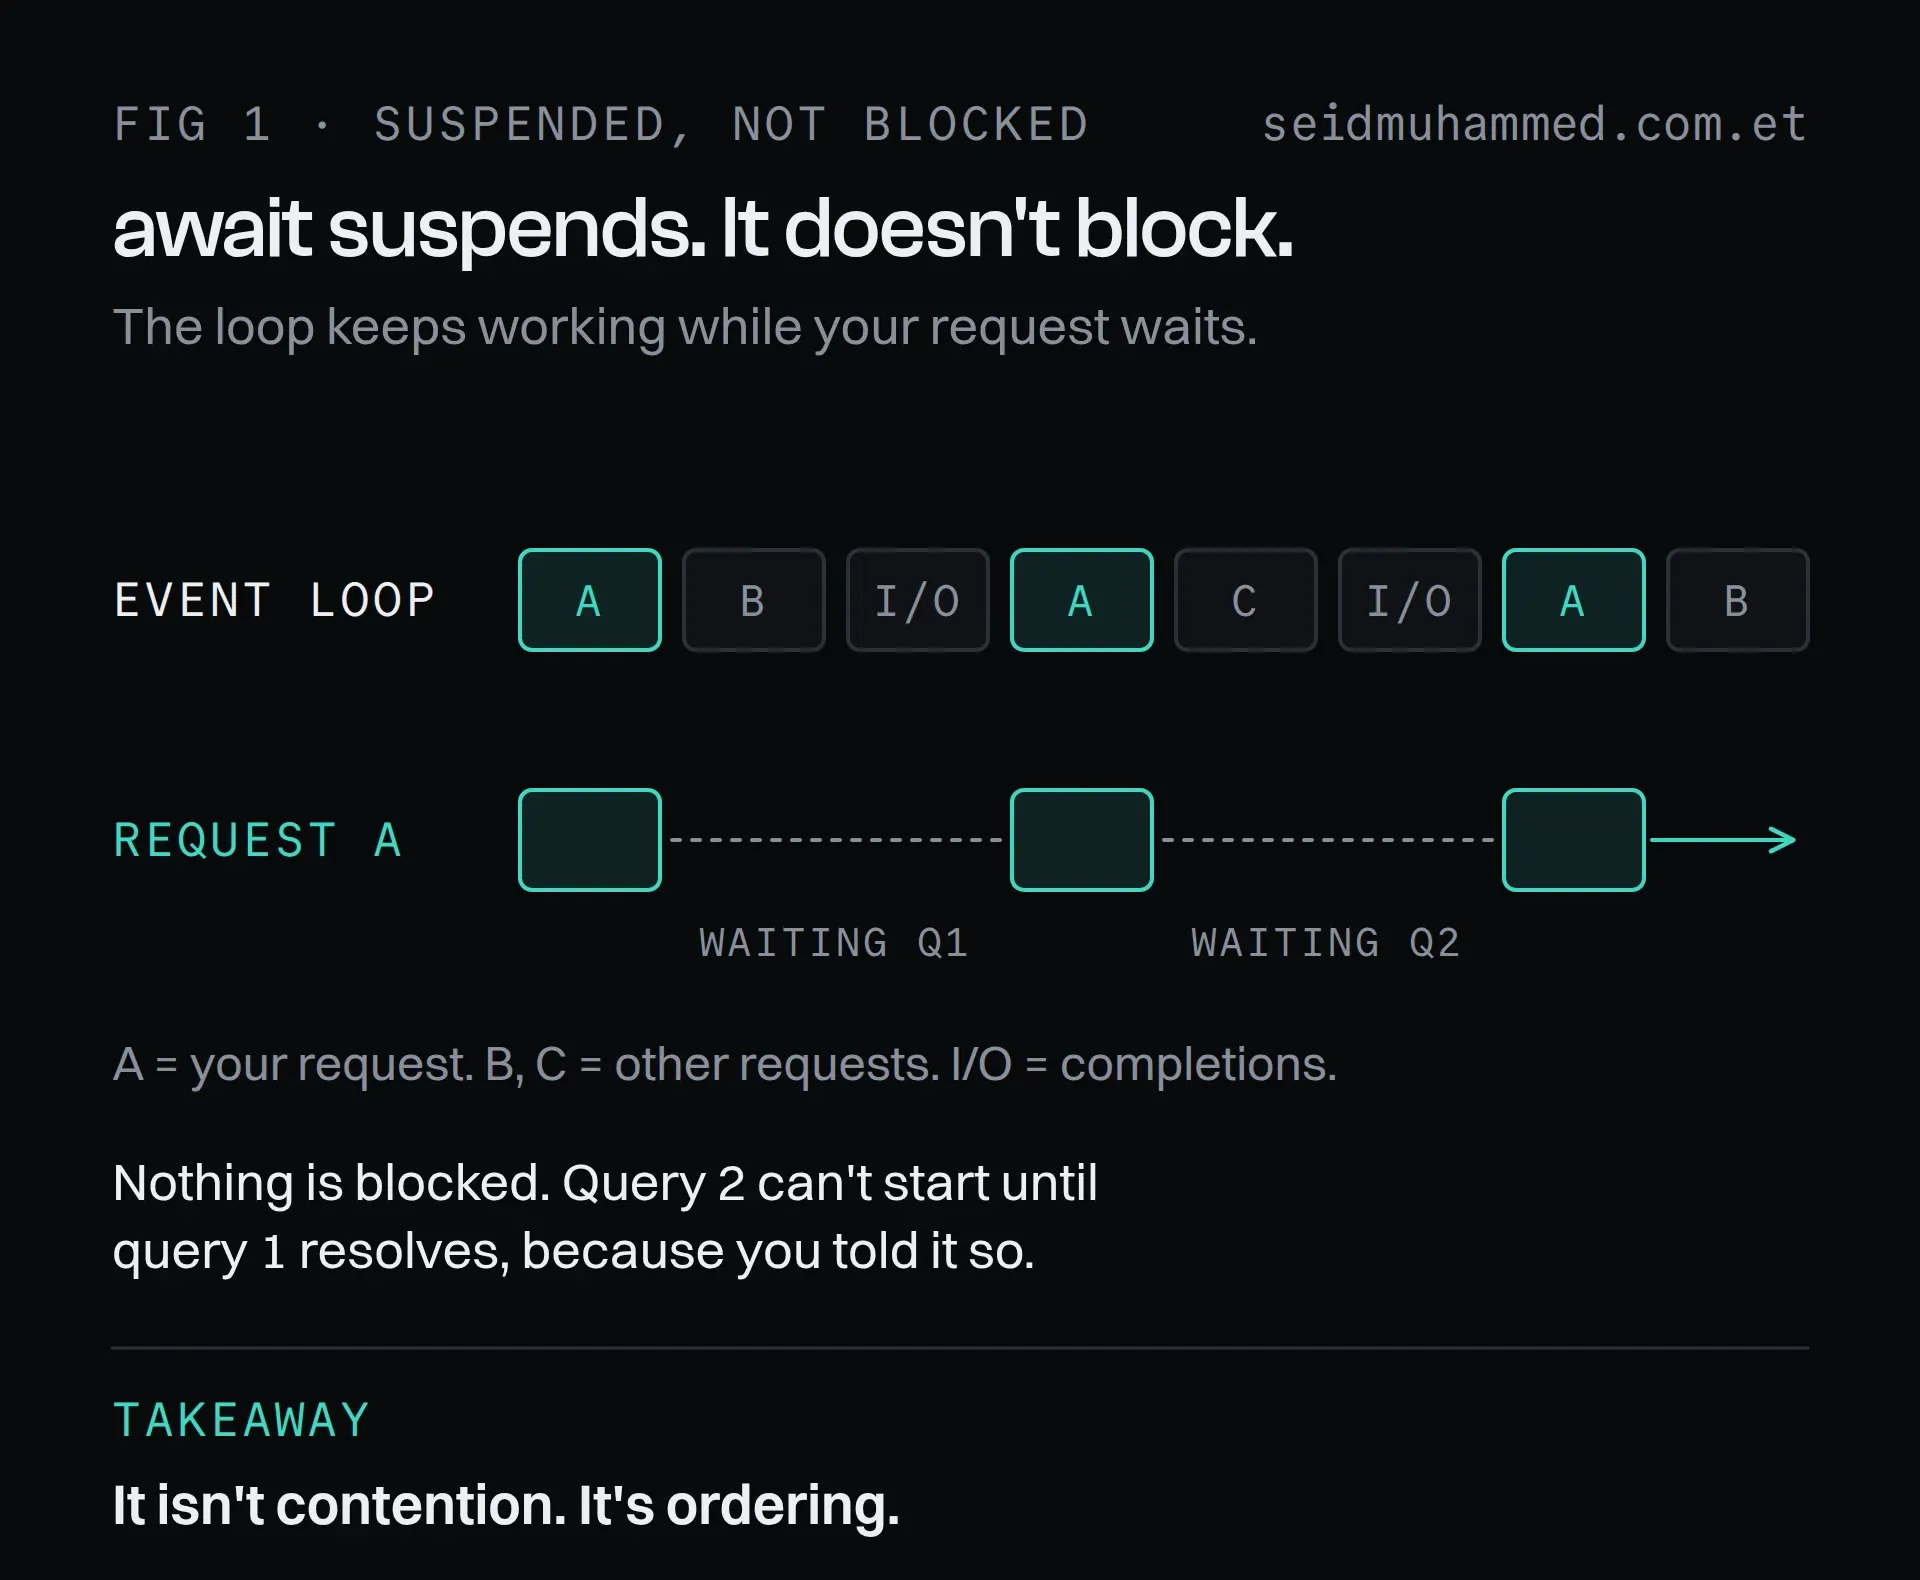
The loop never stops. Request A spends most of its life parked, and the parking is self-imposed.
So the cost is not contention. The cost is latency addition. Three independent queries at 10ms each take 30ms serially and roughly 10ms in parallel, and you paid 20ms for a dependency that does not exist.
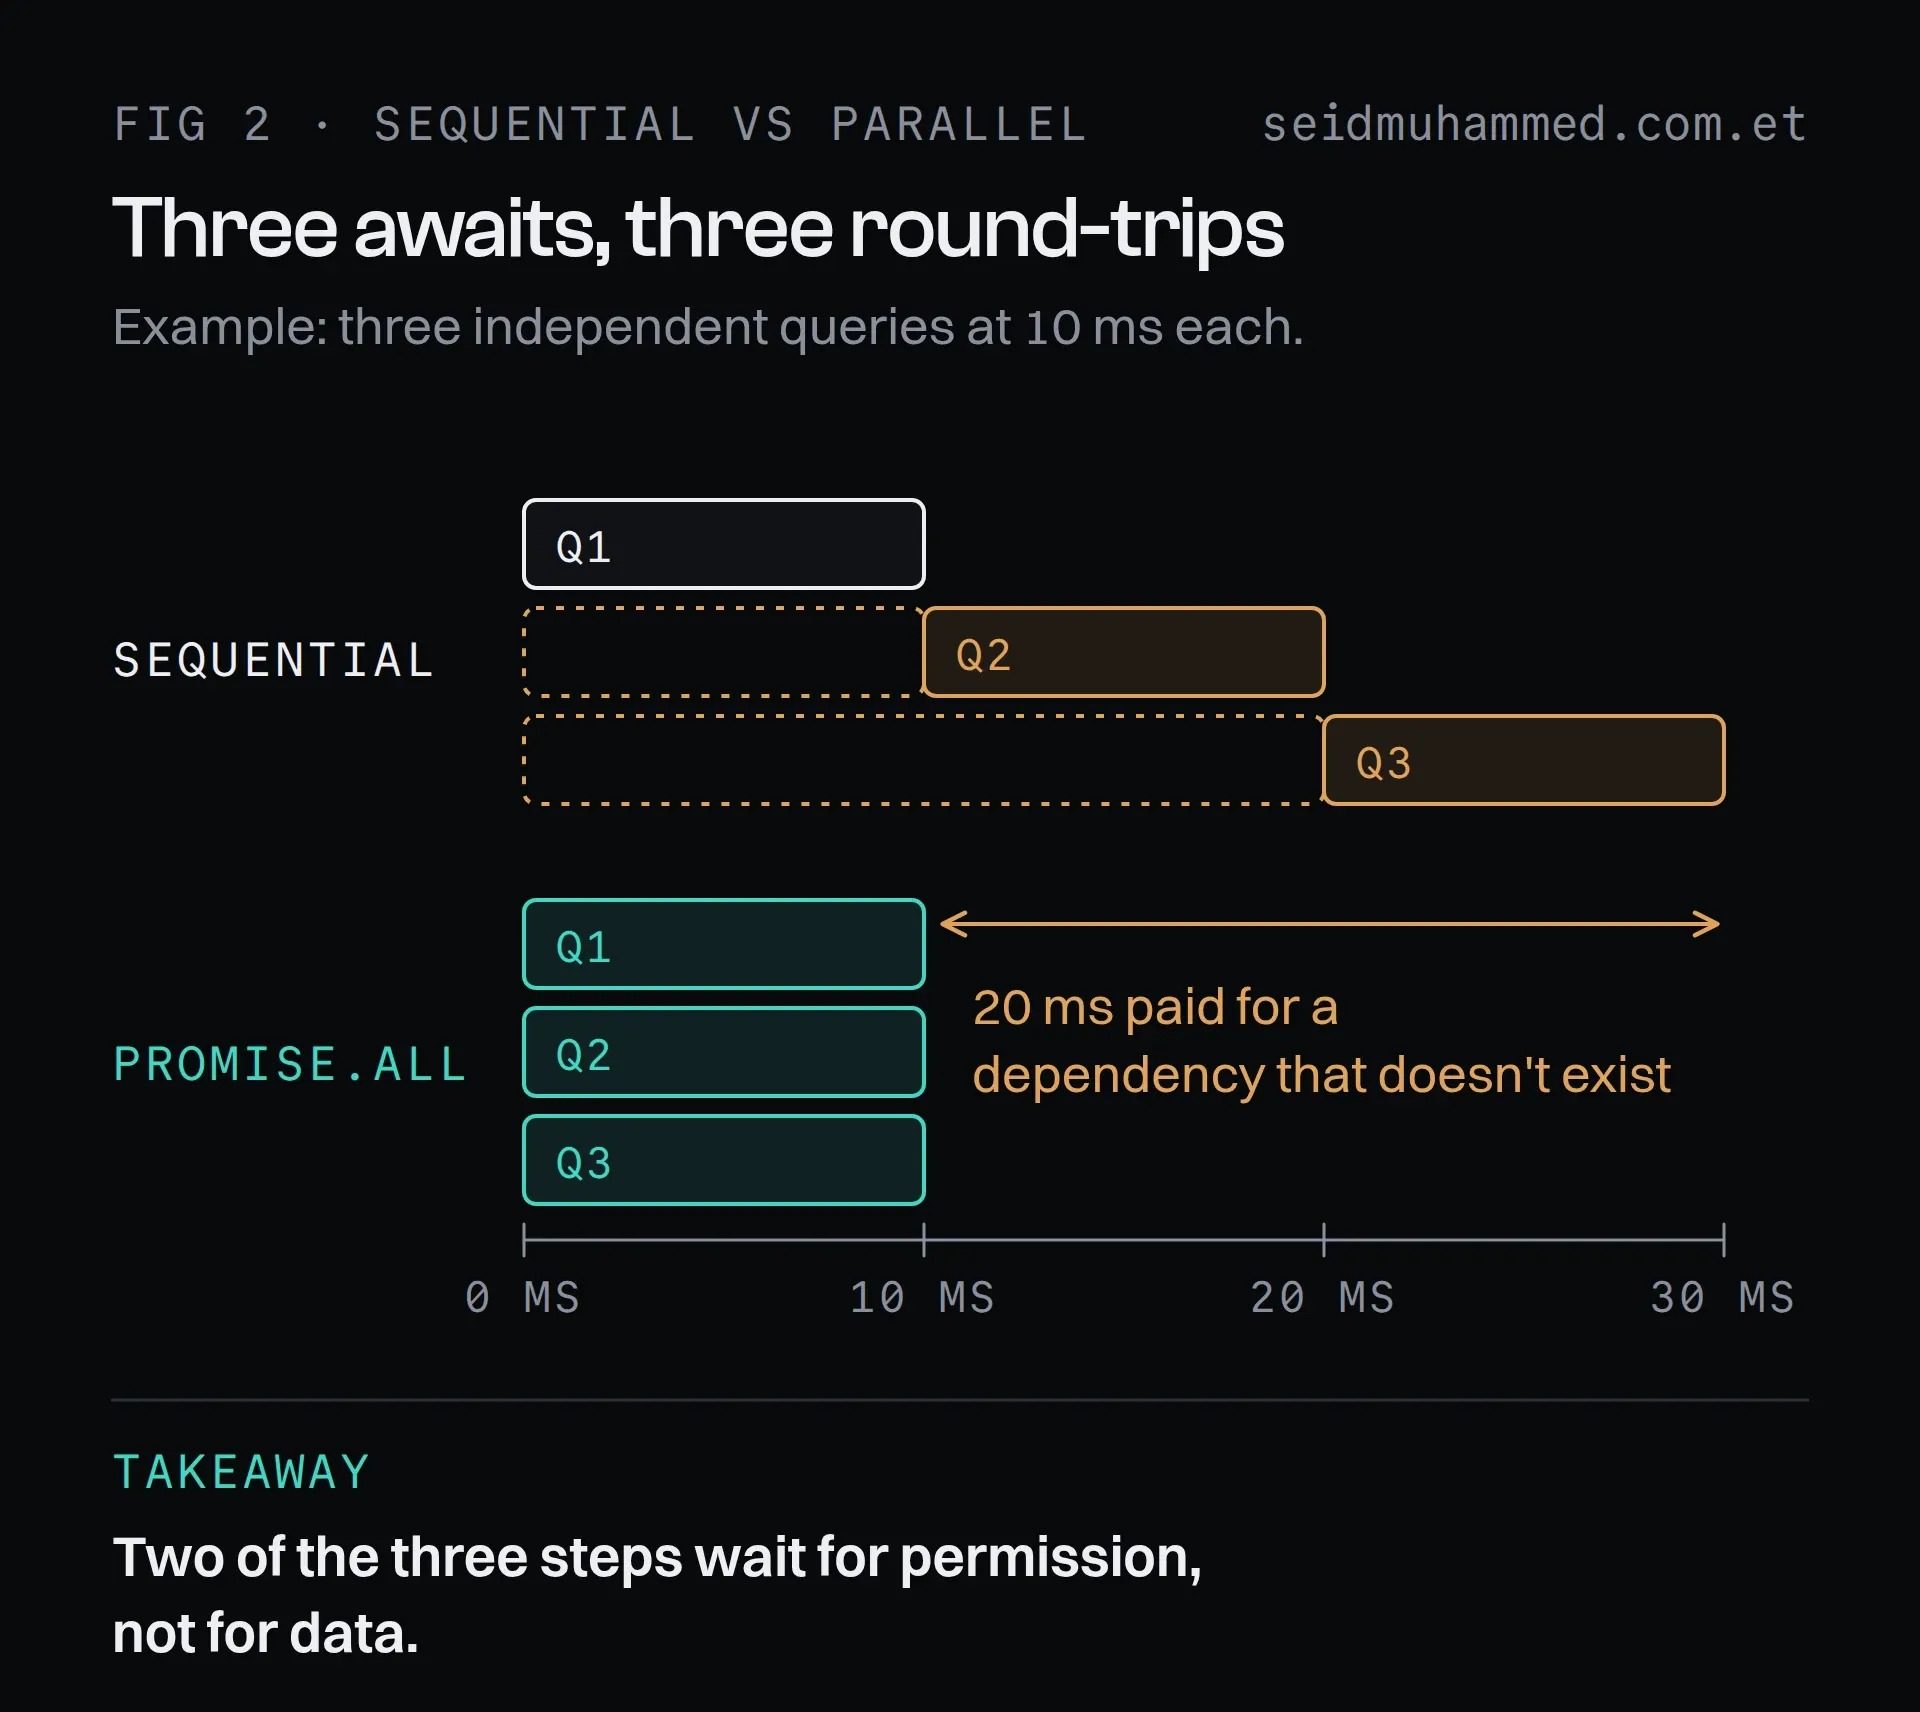
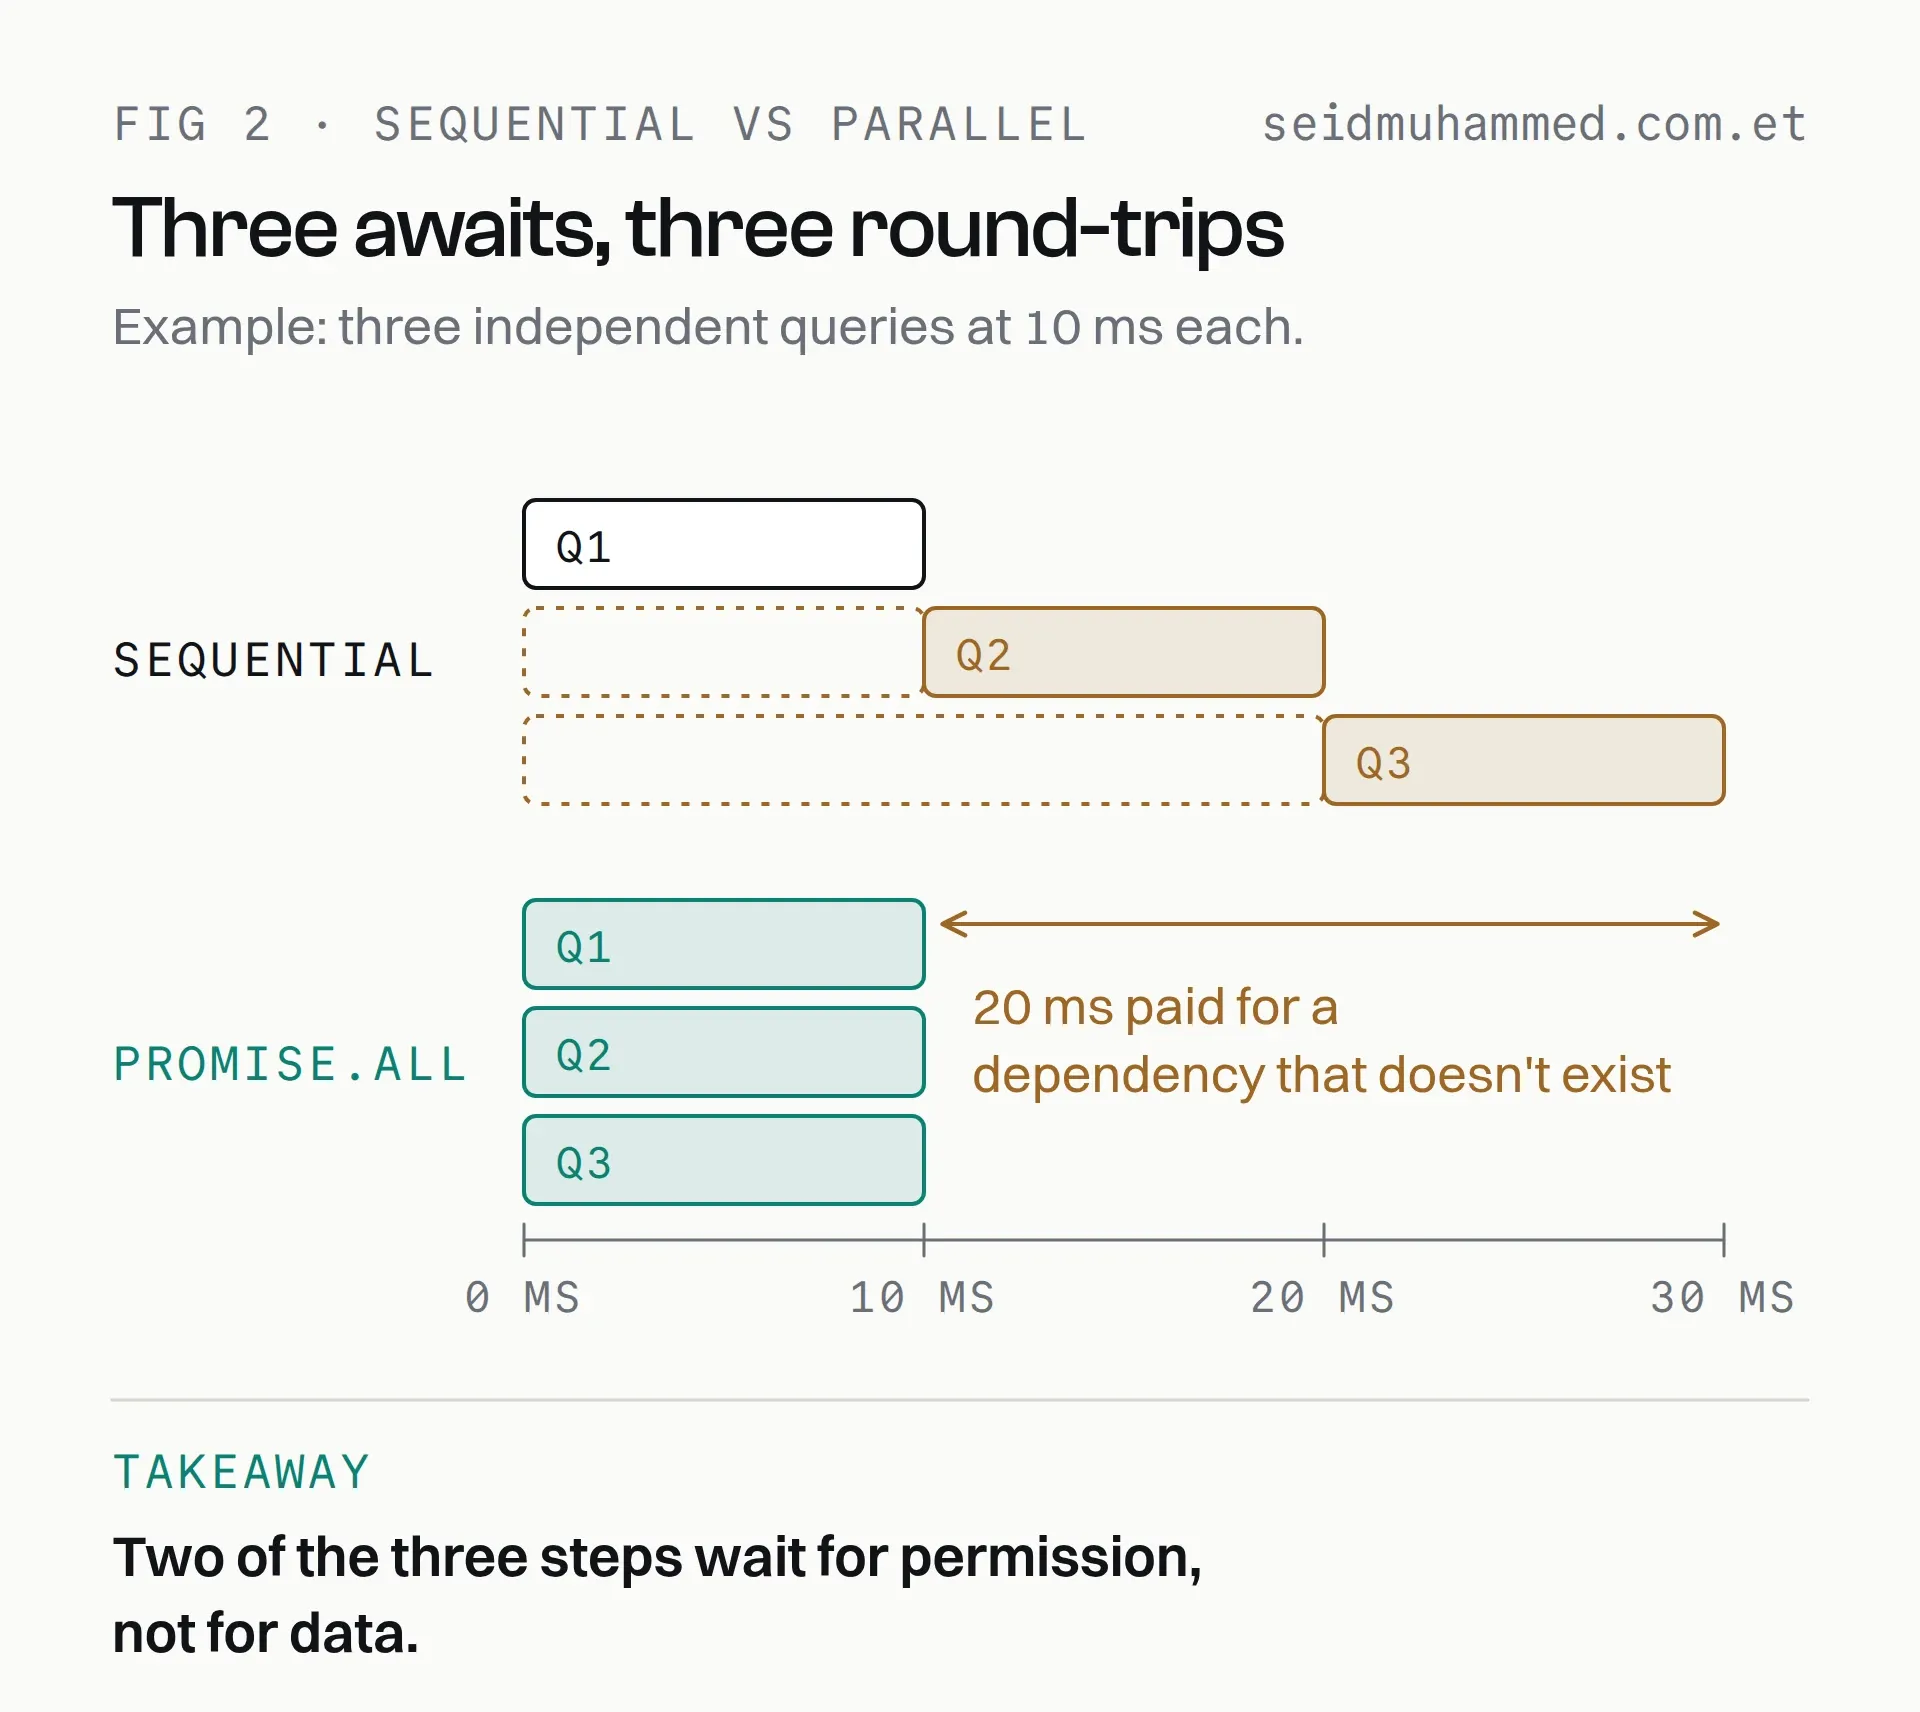
An example, not a measurement. The dashed stretches are queries waiting for permission to start.
Time | Event |
|---|---|
0ms | Request received, query 1 issued |
10ms | Query 1 resolves, microtask schedules query 2 |
20ms | Query 2 resolves, microtask schedules query 3 |
30ms | Query 3 resolves, response sent |
That table is the bug. Two of those three steps are waiting for permission rather than waiting for data.
await doesn't block the event loop. It blocks you.
Why it hurts more than the arithmetic suggests
If the arithmetic were the whole story, sequential awaits would cost you 3× latency and nothing else. Under load, they cost more than that.
A request that takes 30ms instead of 10ms holds its socket, its parsed body, its ORM objects and its closure scope three times longer. Multiply by concurrent requests and you have three times the memory in flight, three times the open handles, and three times the exposure to a slow downstream. Little's Law is unsentimental here: concurrency equals arrival rate times residence time, so tripling residence time triples the number of requests resident in your process at any moment.
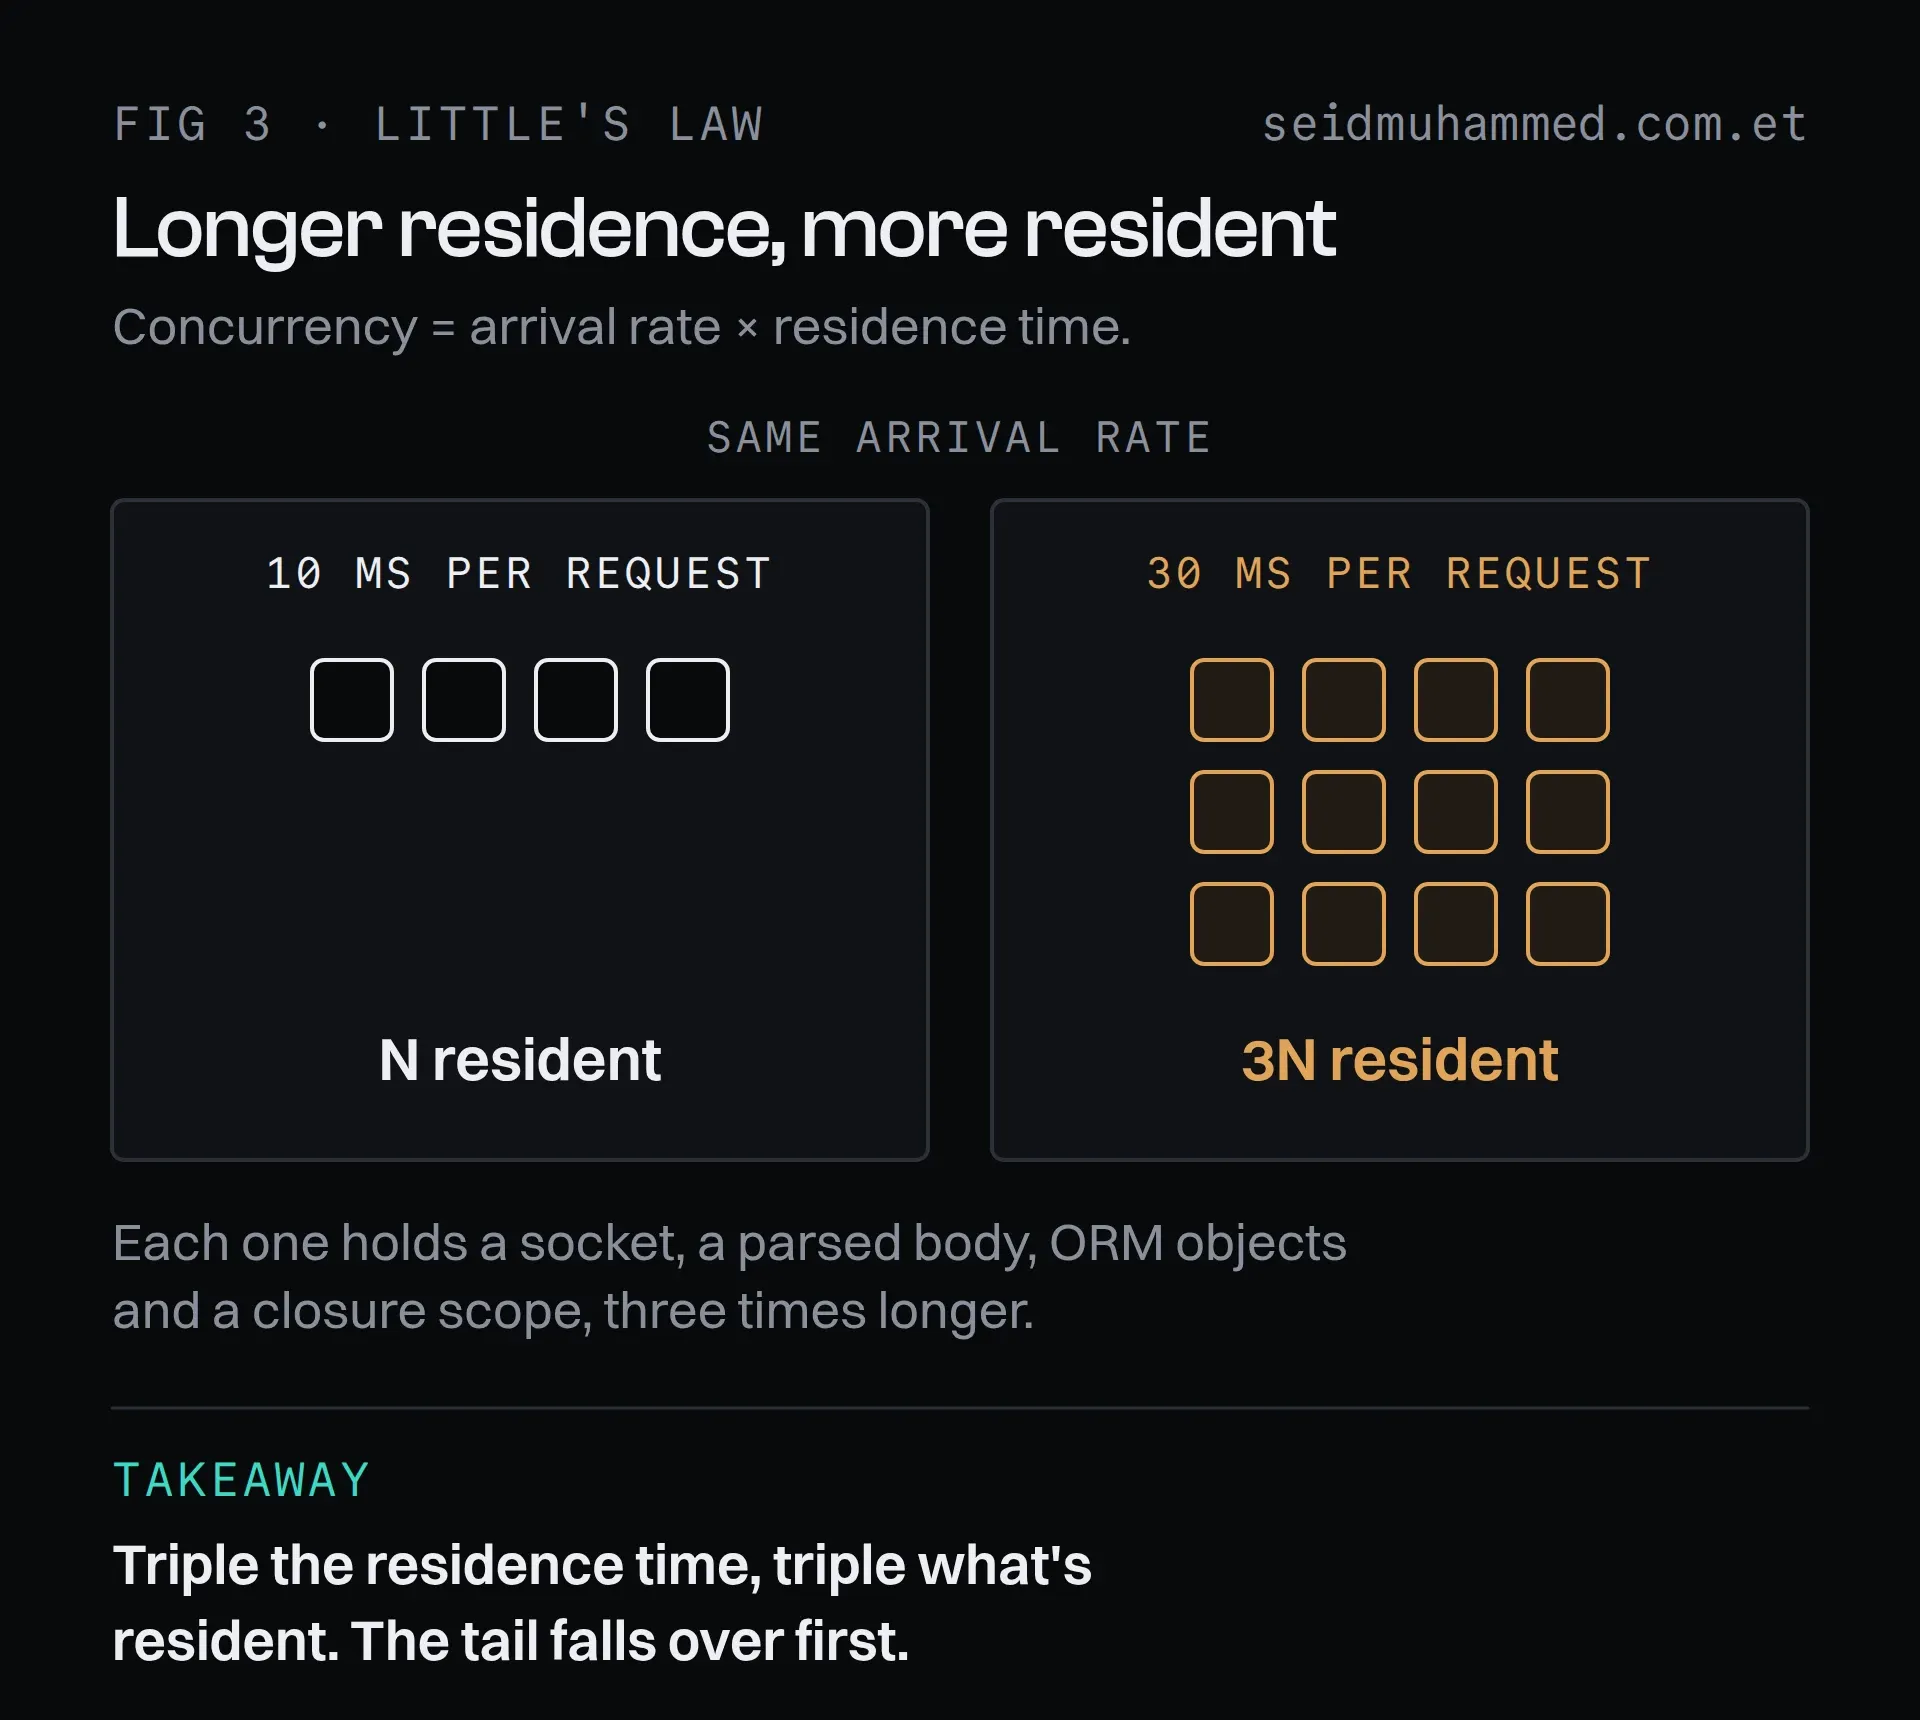
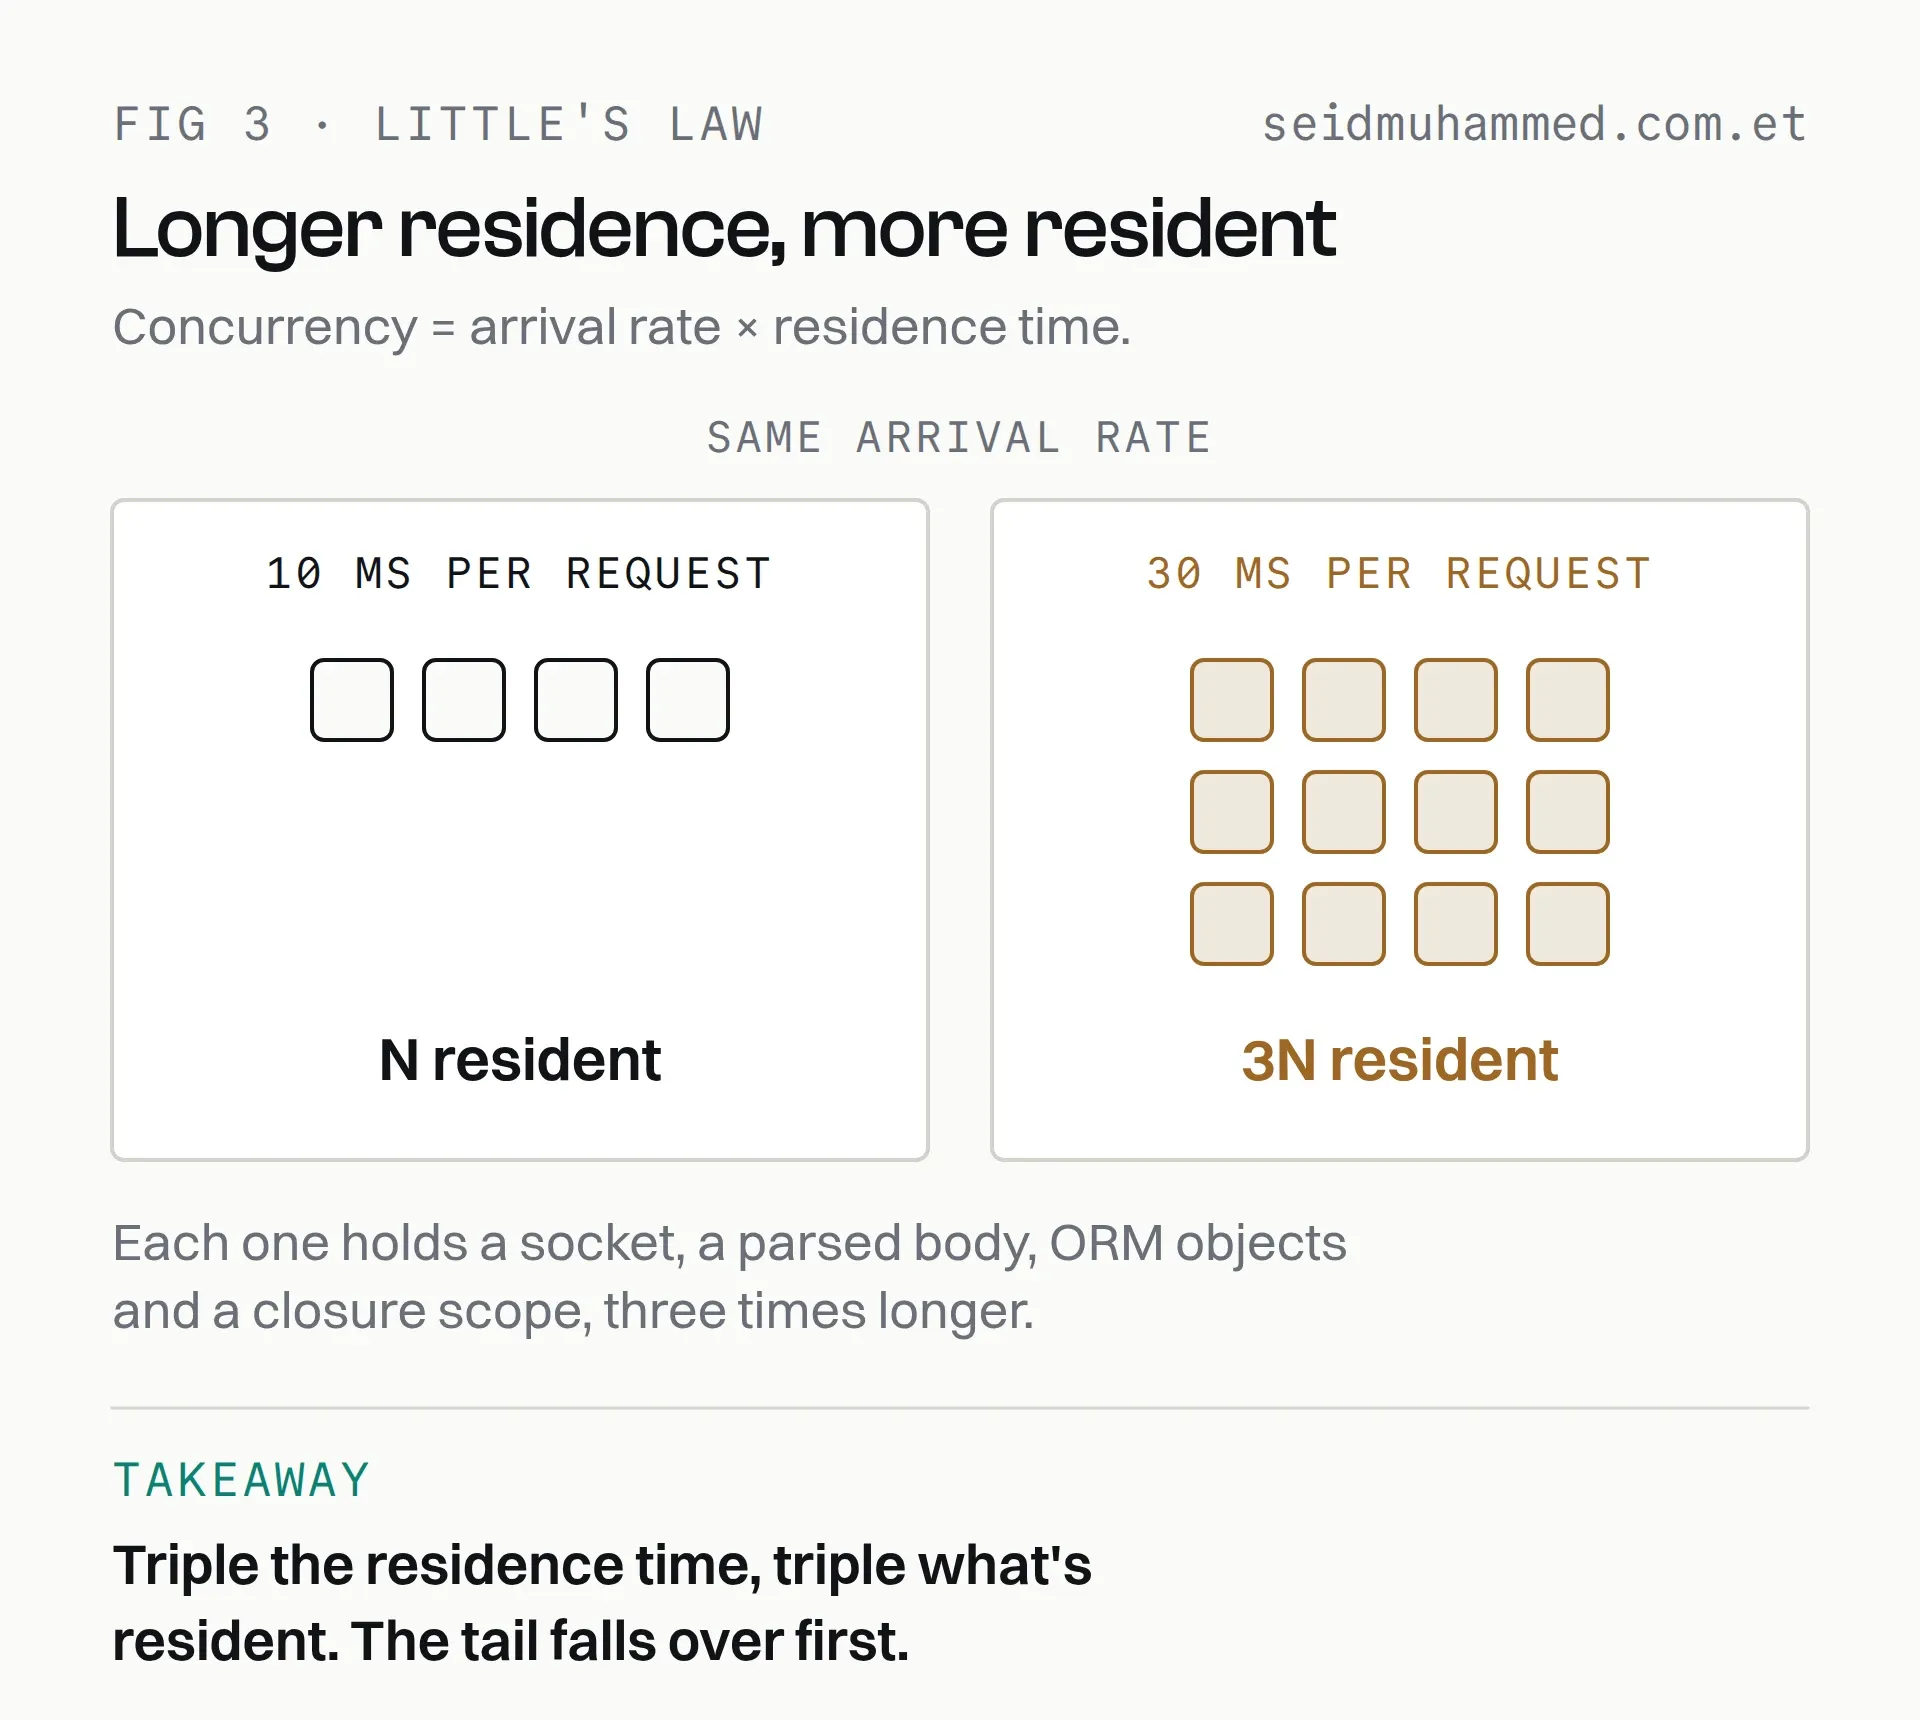
Nothing got slower per request except the waiting. Everything the process holds in memory grew anyway.
That is what turns a latency problem into a stability problem. The median barely moves. The tail falls over.
This is the same trap as reading averages in a benchmark, which I ran into again in Kubernetes vs a single VM: the number that looks fine is not the number your unluckiest users get.
Little's Law turns an extra 20 ms into a stability problem.
The fix, and the part people skip
The obvious fix is Promise.all:
const [user, posts, events] = await Promise.all([
  getUser(userId),
  getPosts(userId),
  getEvents(userId),
])
This is correct when the calls are genuinely independent. Note that the original could not be parallelised as written. It passed user.id into the next two calls, so there was a real dependency until userId was used directly. Half the sequential chains I find are like this: an accidental dependency introduced by reaching through the previous result for a value the caller already had.
Many waterfalls aren't dependencies at all. They're a field read off the wrong variable.
Promise.all has a sharp edge, though. It rejects on the first failure and abandons the rest, which means one flaky downstream takes down a response that could have degraded gracefully. When partial results are acceptable, Promise.allSettled with explicit per-call timeouts is the version that survives production:
const withTimeout = (promise, ms, label) =>
  Promise.race([
    promise,
    new Promise((_, reject) =>
      setTimeout(() => reject(new Error(`${label} timed out after ${ms}ms`)), ms),
    ),
  ])

async function fetchDashboard(userId) {
  const [user, posts, events] = await Promise.allSettled([
    withTimeout(getUser(userId), 200, 'getUser'),
    withTimeout(getPosts(userId), 200, 'getPosts'),
    withTimeout(getEvents(userId), 200, 'getEvents'),
  ])

  // The user is load-bearing; the rest of the page is not.
  if (user.status === 'rejected') throw user.reason


  return {
    user: user.value,
    posts: posts.status === 'fulfilled' ? posts.value : [],
    events: events.status === 'fulfilled' ? events.value : [],
  }
}
Two things are deliberate. Every call has a timeout, because an unbounded await is an unbounded residence time and therefore an unbounded queue. And the failure policy is explicit per call: the user object is required, the sidebars are not. That distinction belongs in code, not in a comment.
Promise.all without timeouts lets one hung dependency hold the whole response.
What the numbers looked like
Comparing the sequential and parallel versions of the same three-query endpoint:
| Sequential | |
|---|---|---|
Throughput | ~150 req/sec | ~450 req/sec |
Median latency | ~250 ms | ~80 ms |
p95 latency | ~320 ms | ~120 ms |
Absolute numbers depend entirely on hardware, database and payload size, so do not read them as a benchmark of anything but this change. The ratio is the part that transfers: roughly 3× throughput and a p95 that improves more than the median does, which is the signature of removing queueing rather than removing work.
Where this does not apply
Parallelising is not free and not always right.
Fanning out ten queries at once against a connection pool of five moves the queue from your event loop into your database driver, and the tail latency follows it there. If the calls contend for the same scarce resource, parallelism converts a visible serial delay into an invisible pool wait. Check the pool size before you widen the fan-out.
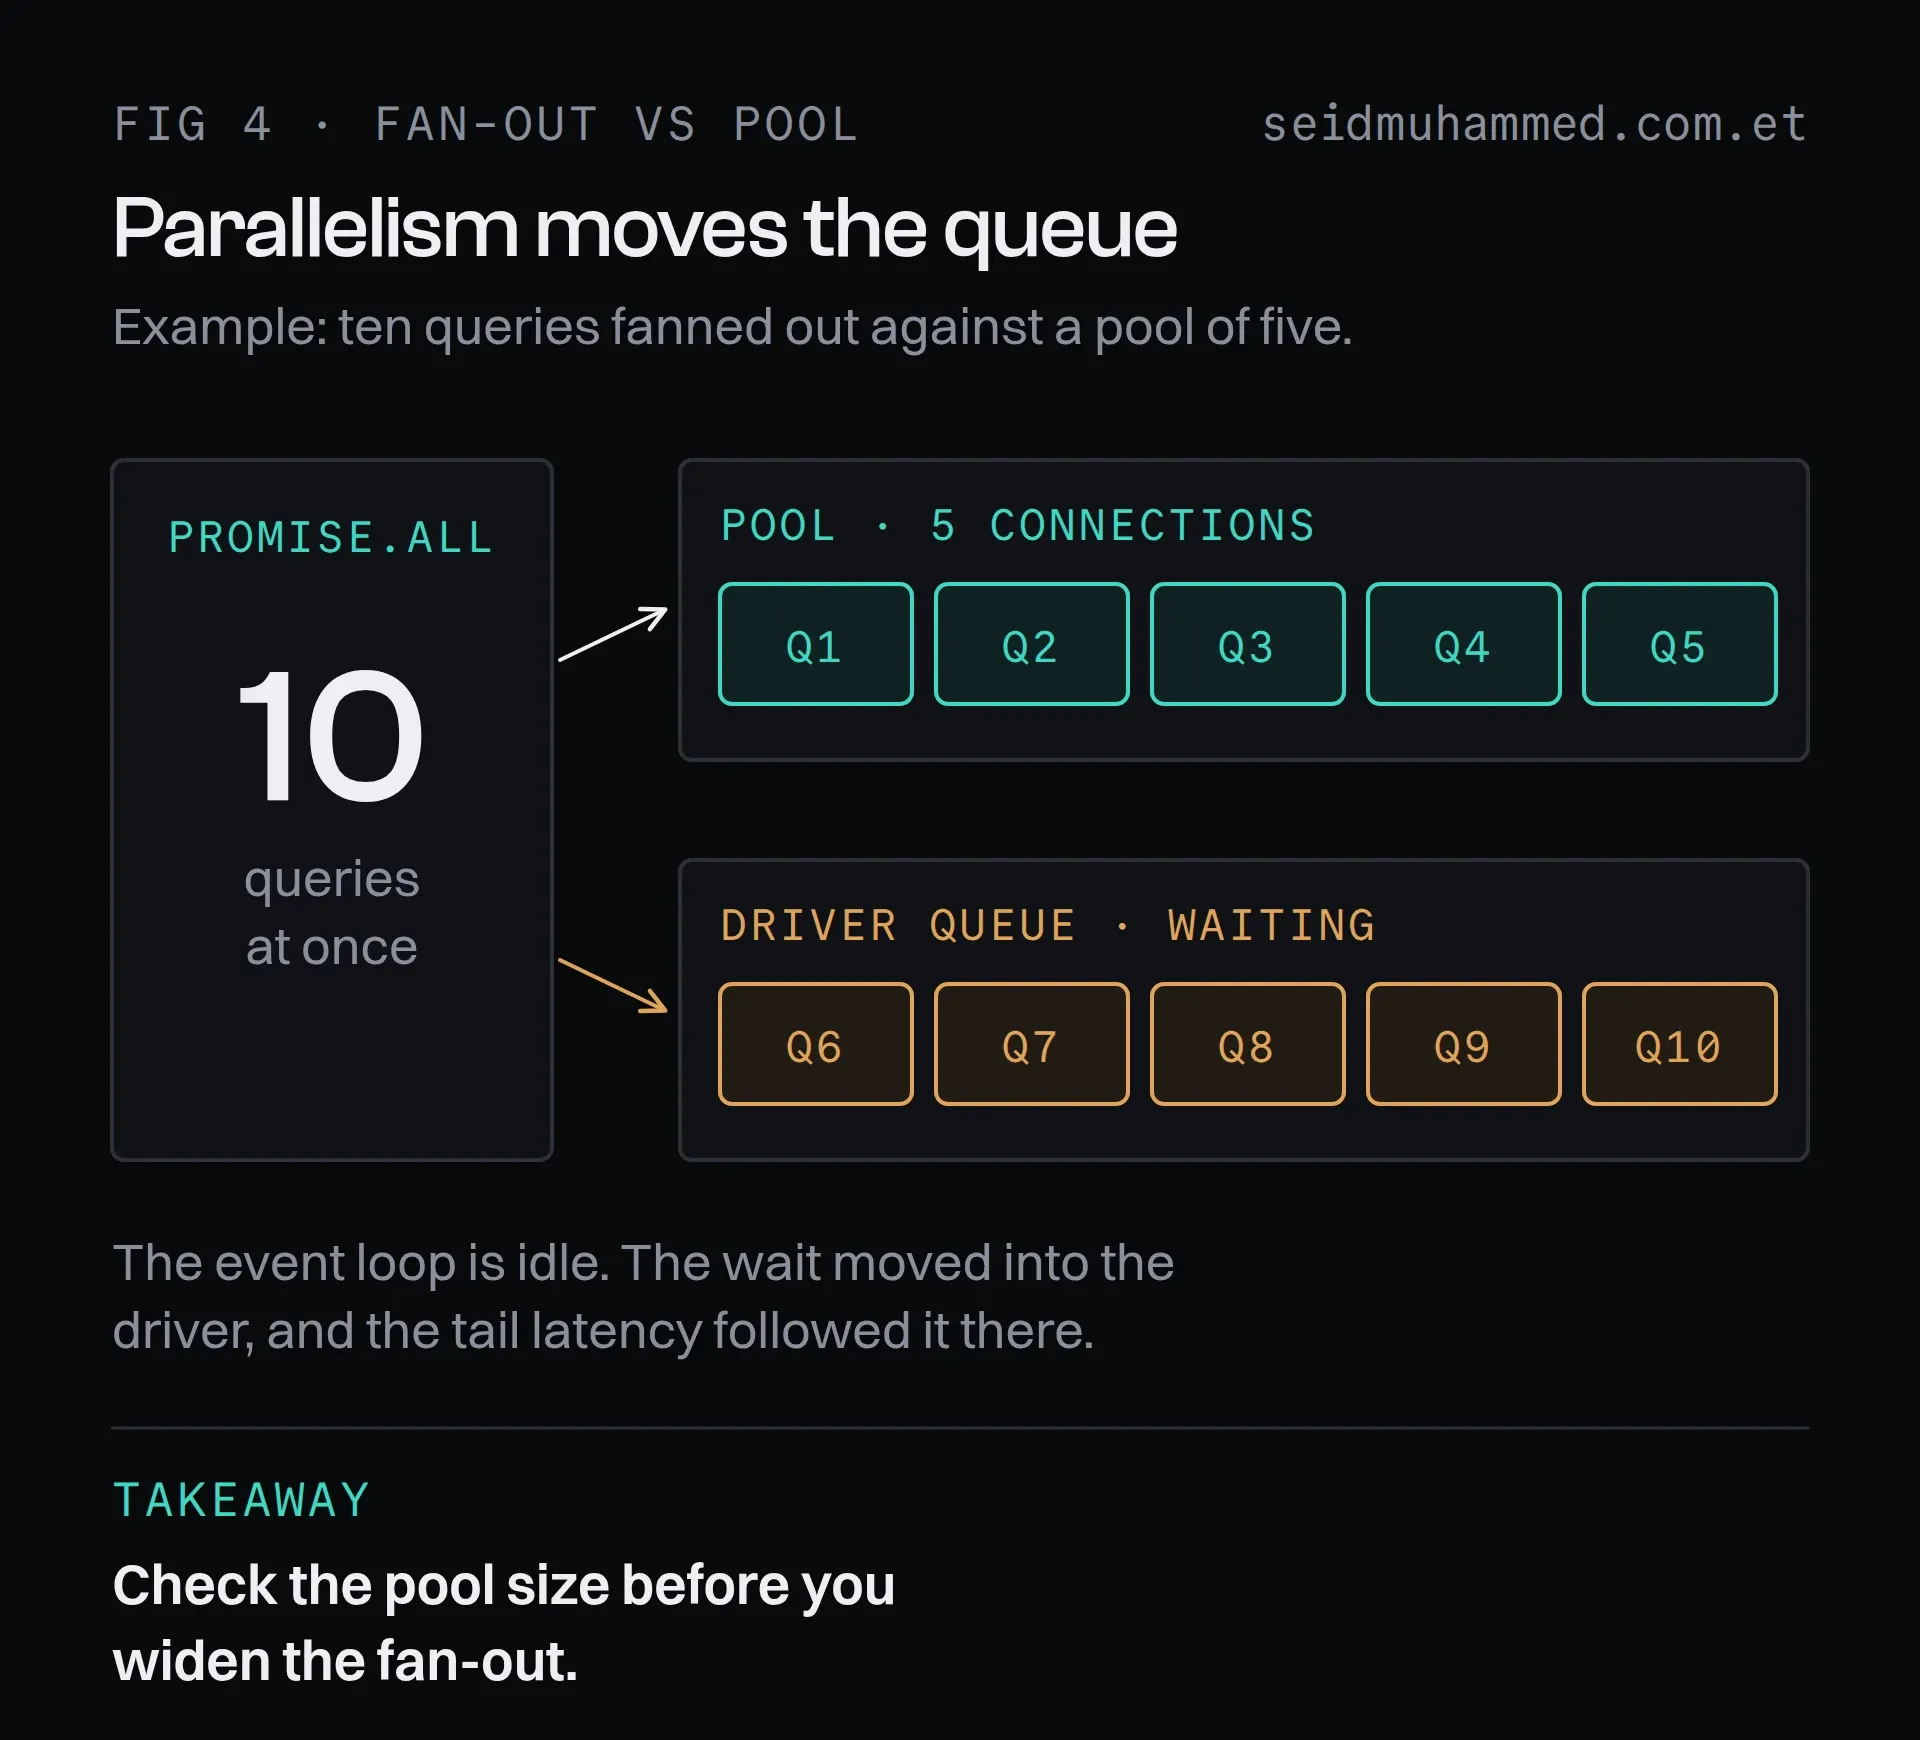
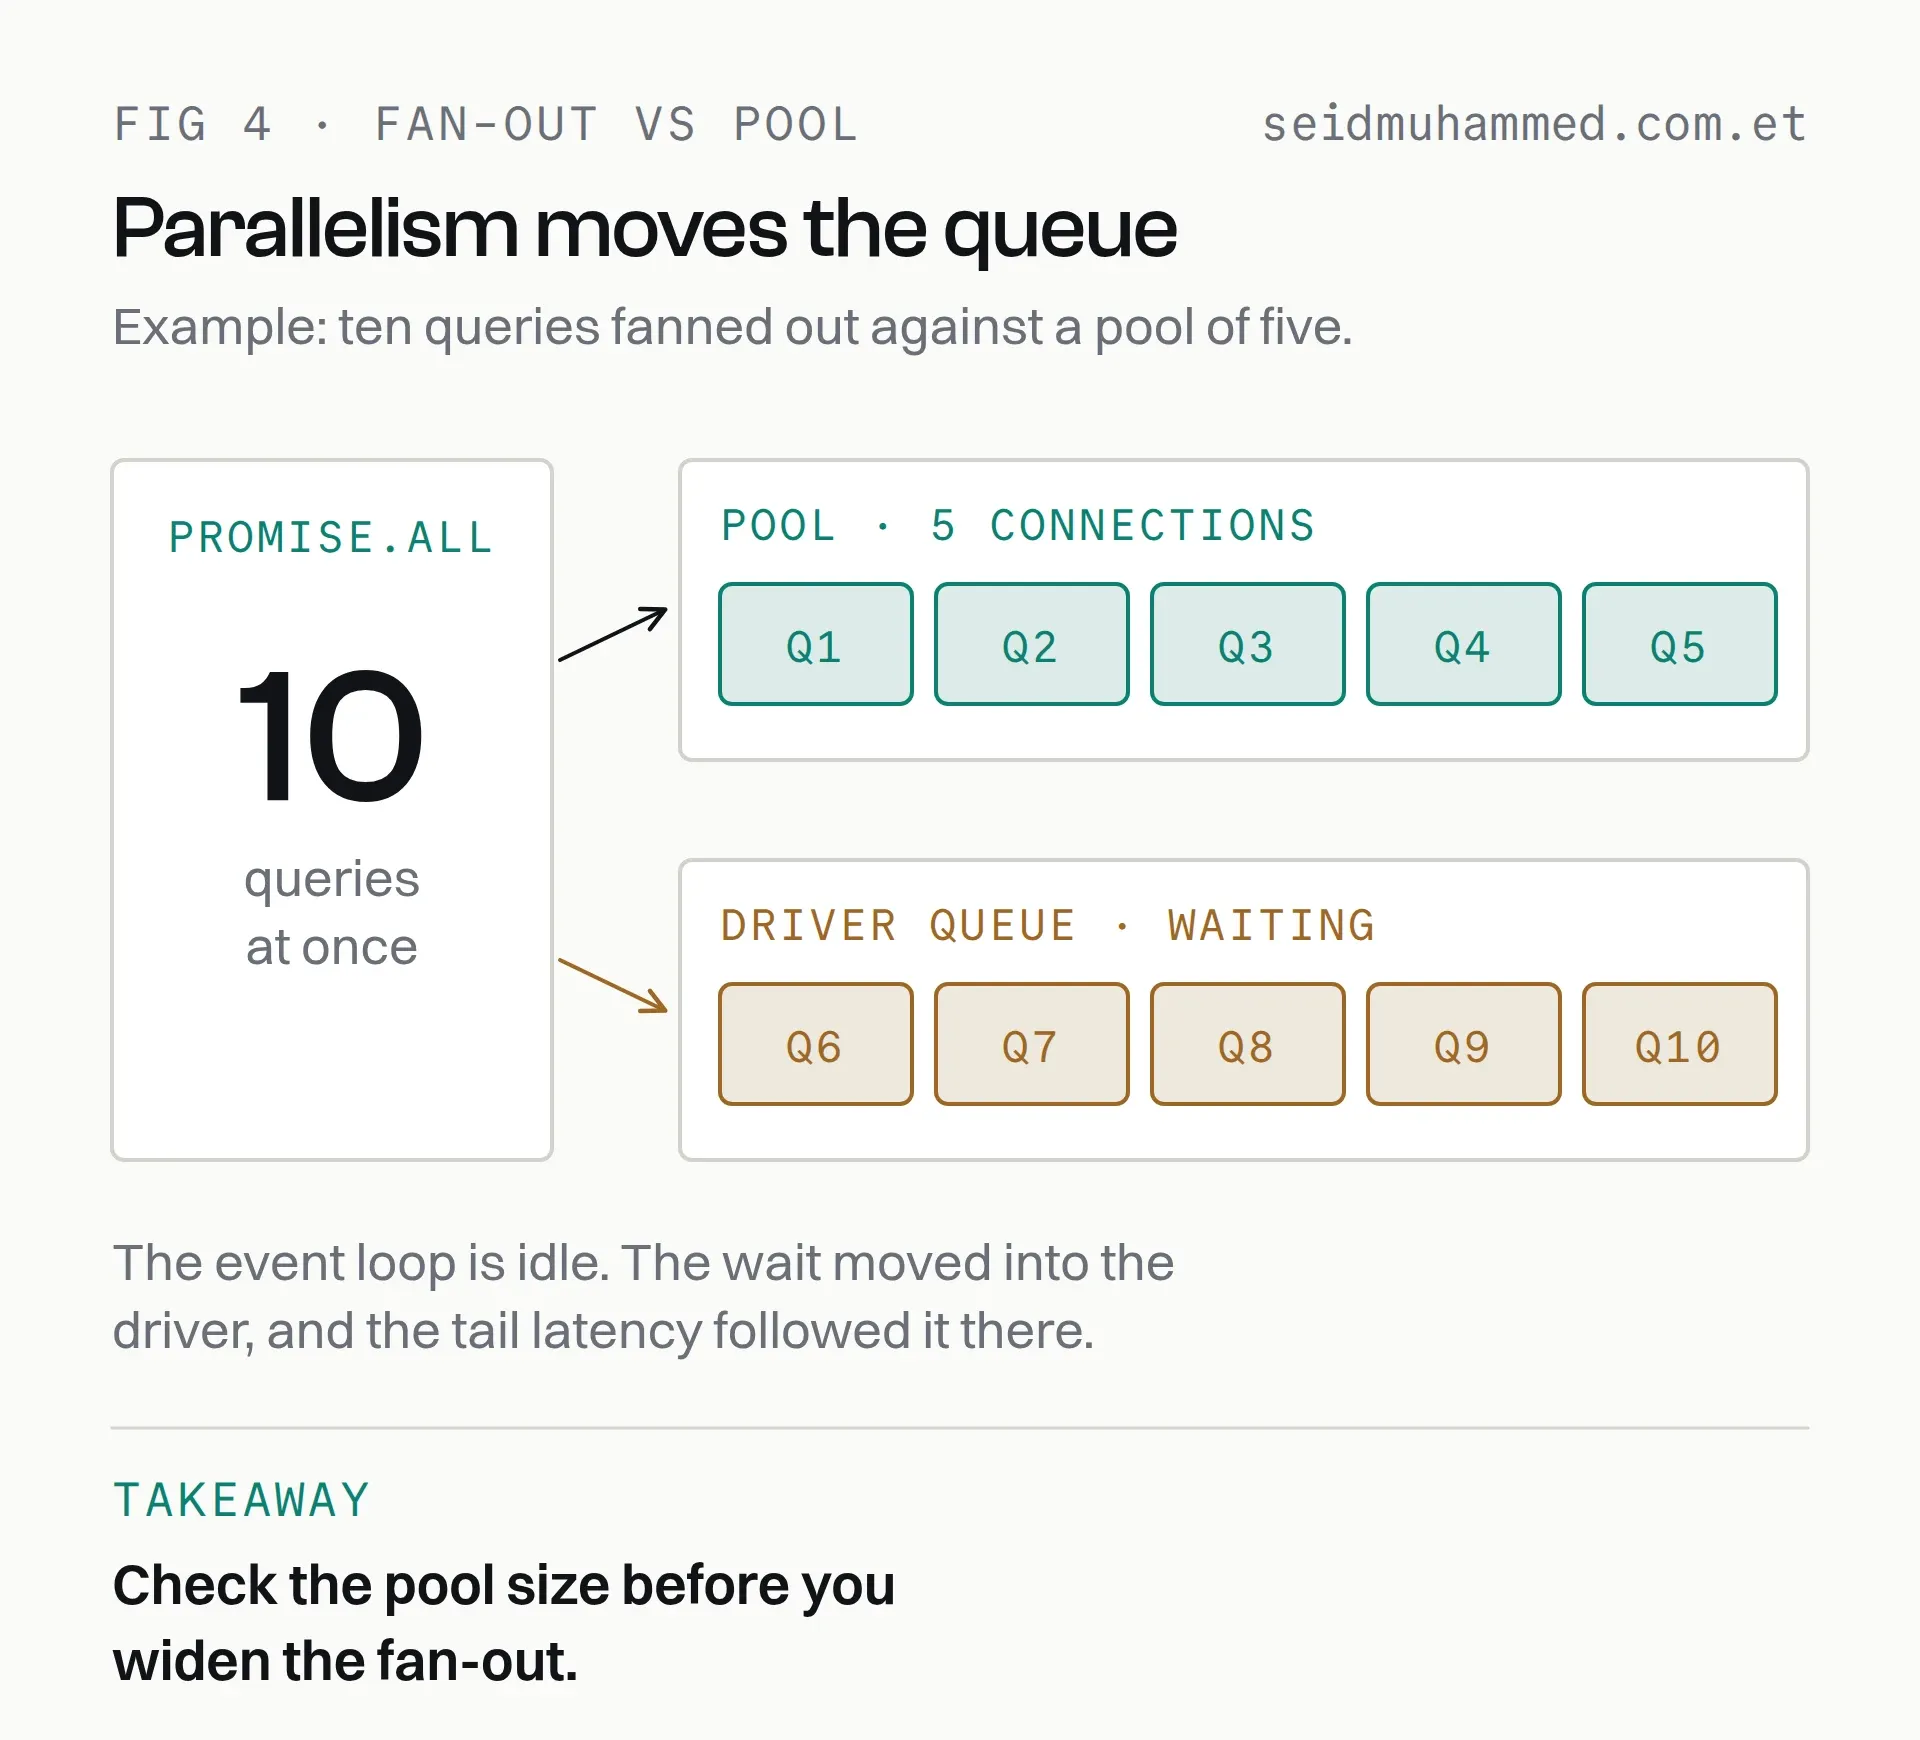
An illustrative ten-and-five. The wait didn't disappear. It moved somewhere your traces may not show it.
Genuinely dependent calls stay sequential, and that is fine. The goal is not to eliminate await chains, it is to eliminate the ones that are chains only by accident. Sometimes sequential is the design: in PlanReel's document extraction, chunks run one after another on purpose, because they share one tokens-per-minute window and parallelising them would recreate the failure being fixed.
And if the work is CPU-bound rather than I/O-bound (hashing, image processing, large JSON serialisation), none of this helps, because now you really are occupying the loop. That work belongs in a worker thread or a separate process, and no amount of Promise.all will save it.
Parallelism doesn't remove a queue. It chooses where the queue lives.
Find it
The reliable signal is a gap between your database's reported query time and your endpoint's total time that scales with the number of queries. If three 10ms queries produce a 35ms endpoint, you have a waterfall. If they produce a 12ms endpoint, you do not.
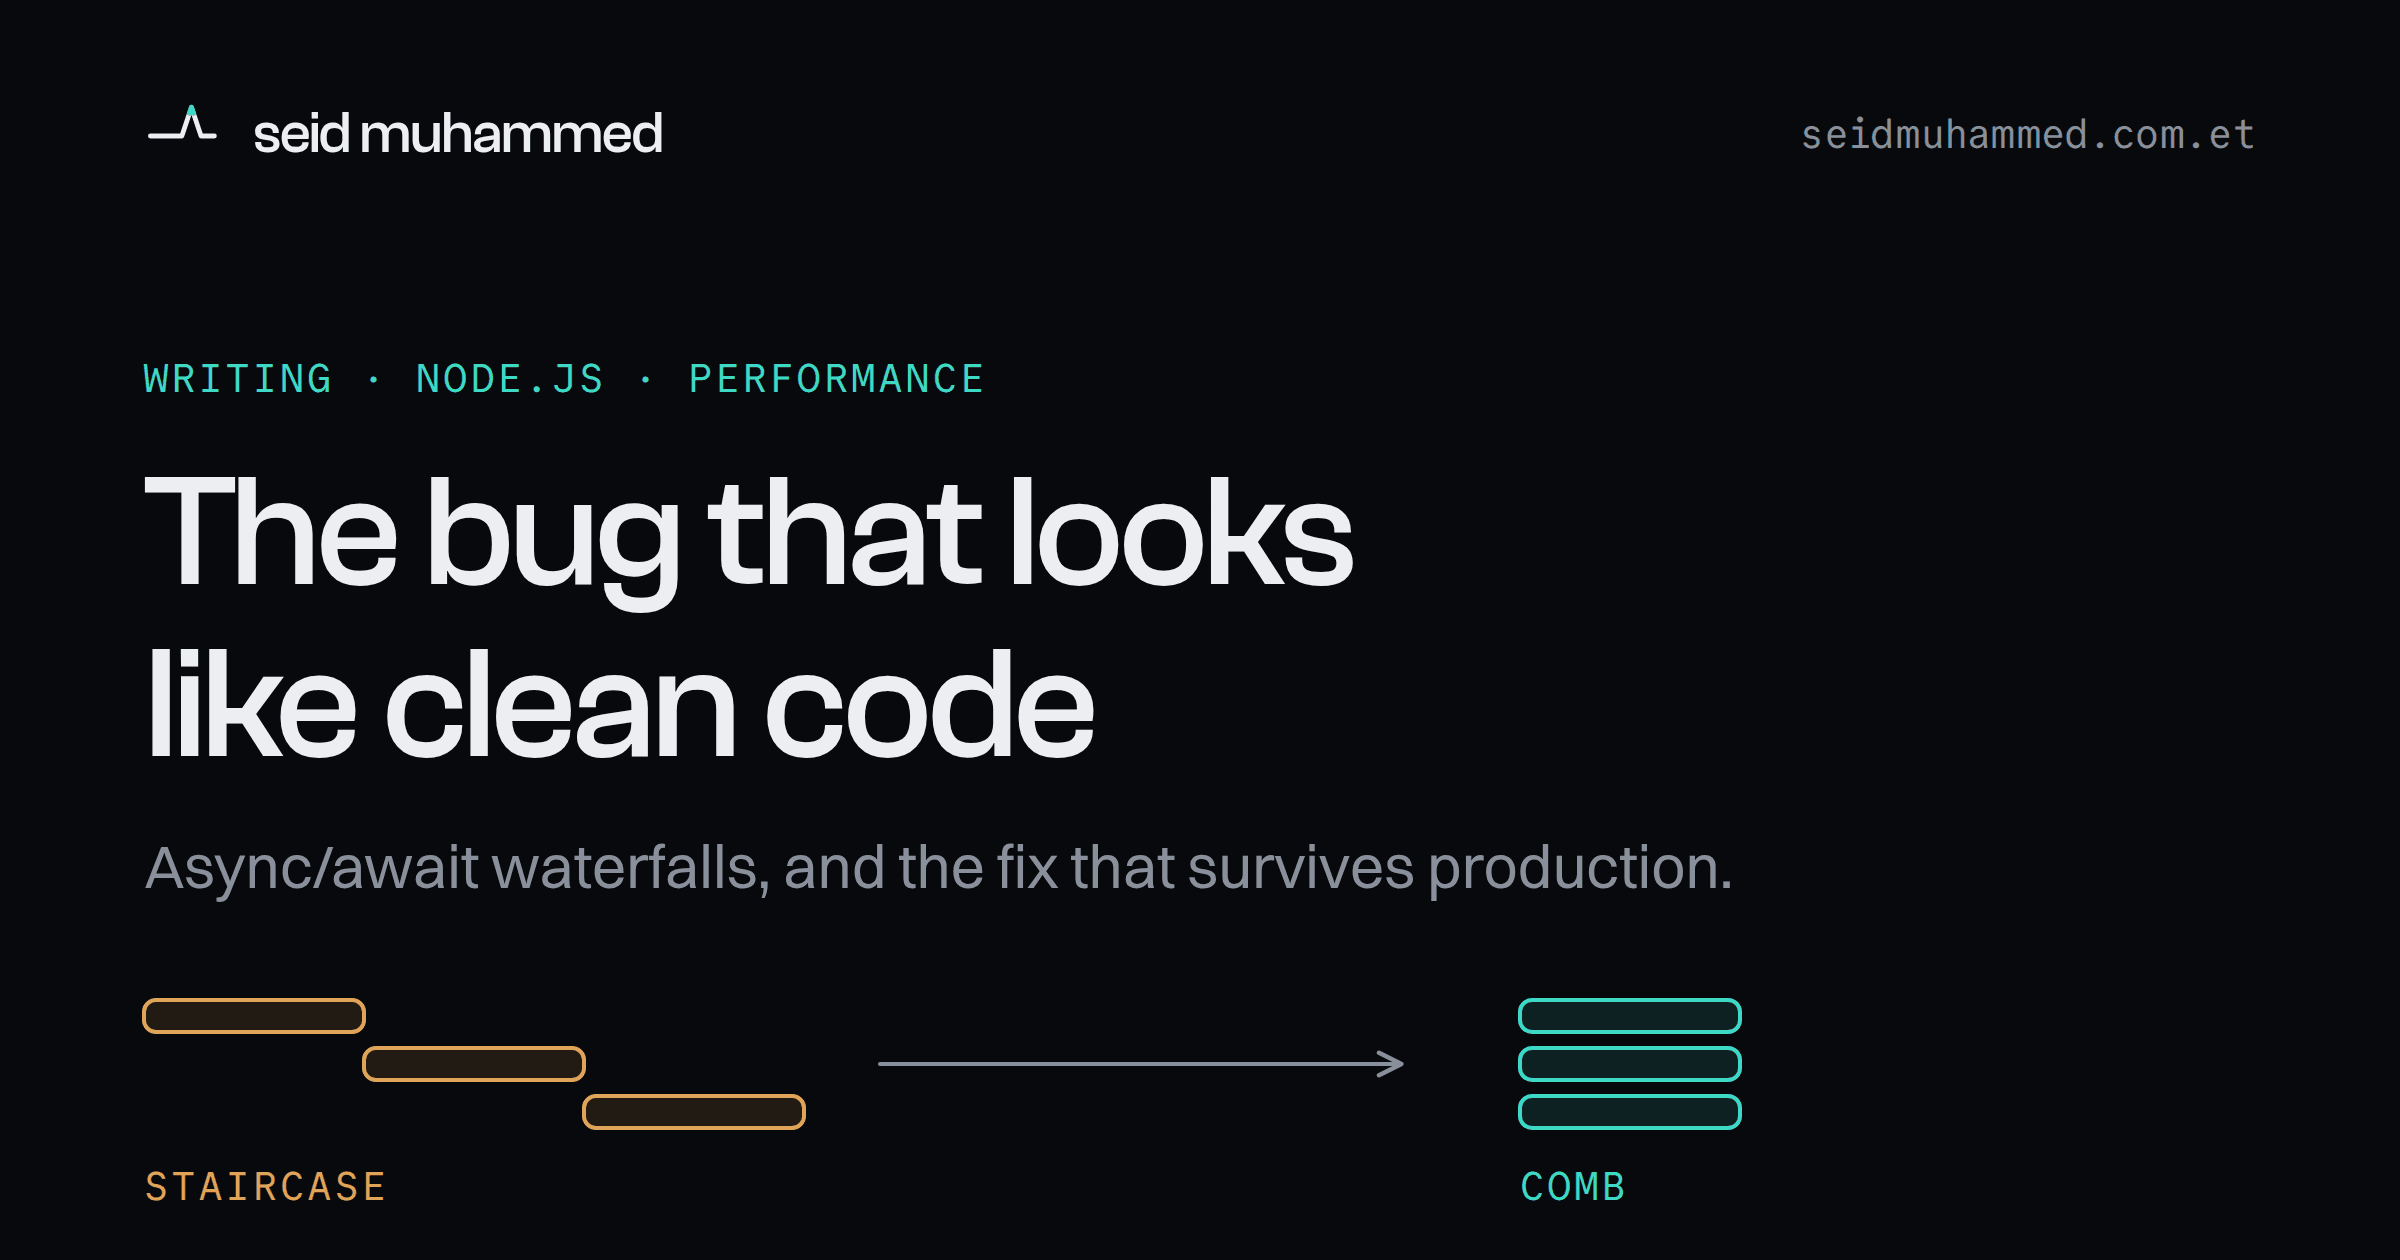
Anything that gives you a span waterfall per request will show it immediately. The shape is unmistakable: a staircase where you expected a comb. Failing that, log timestamps around each call for a day and look at the deltas.
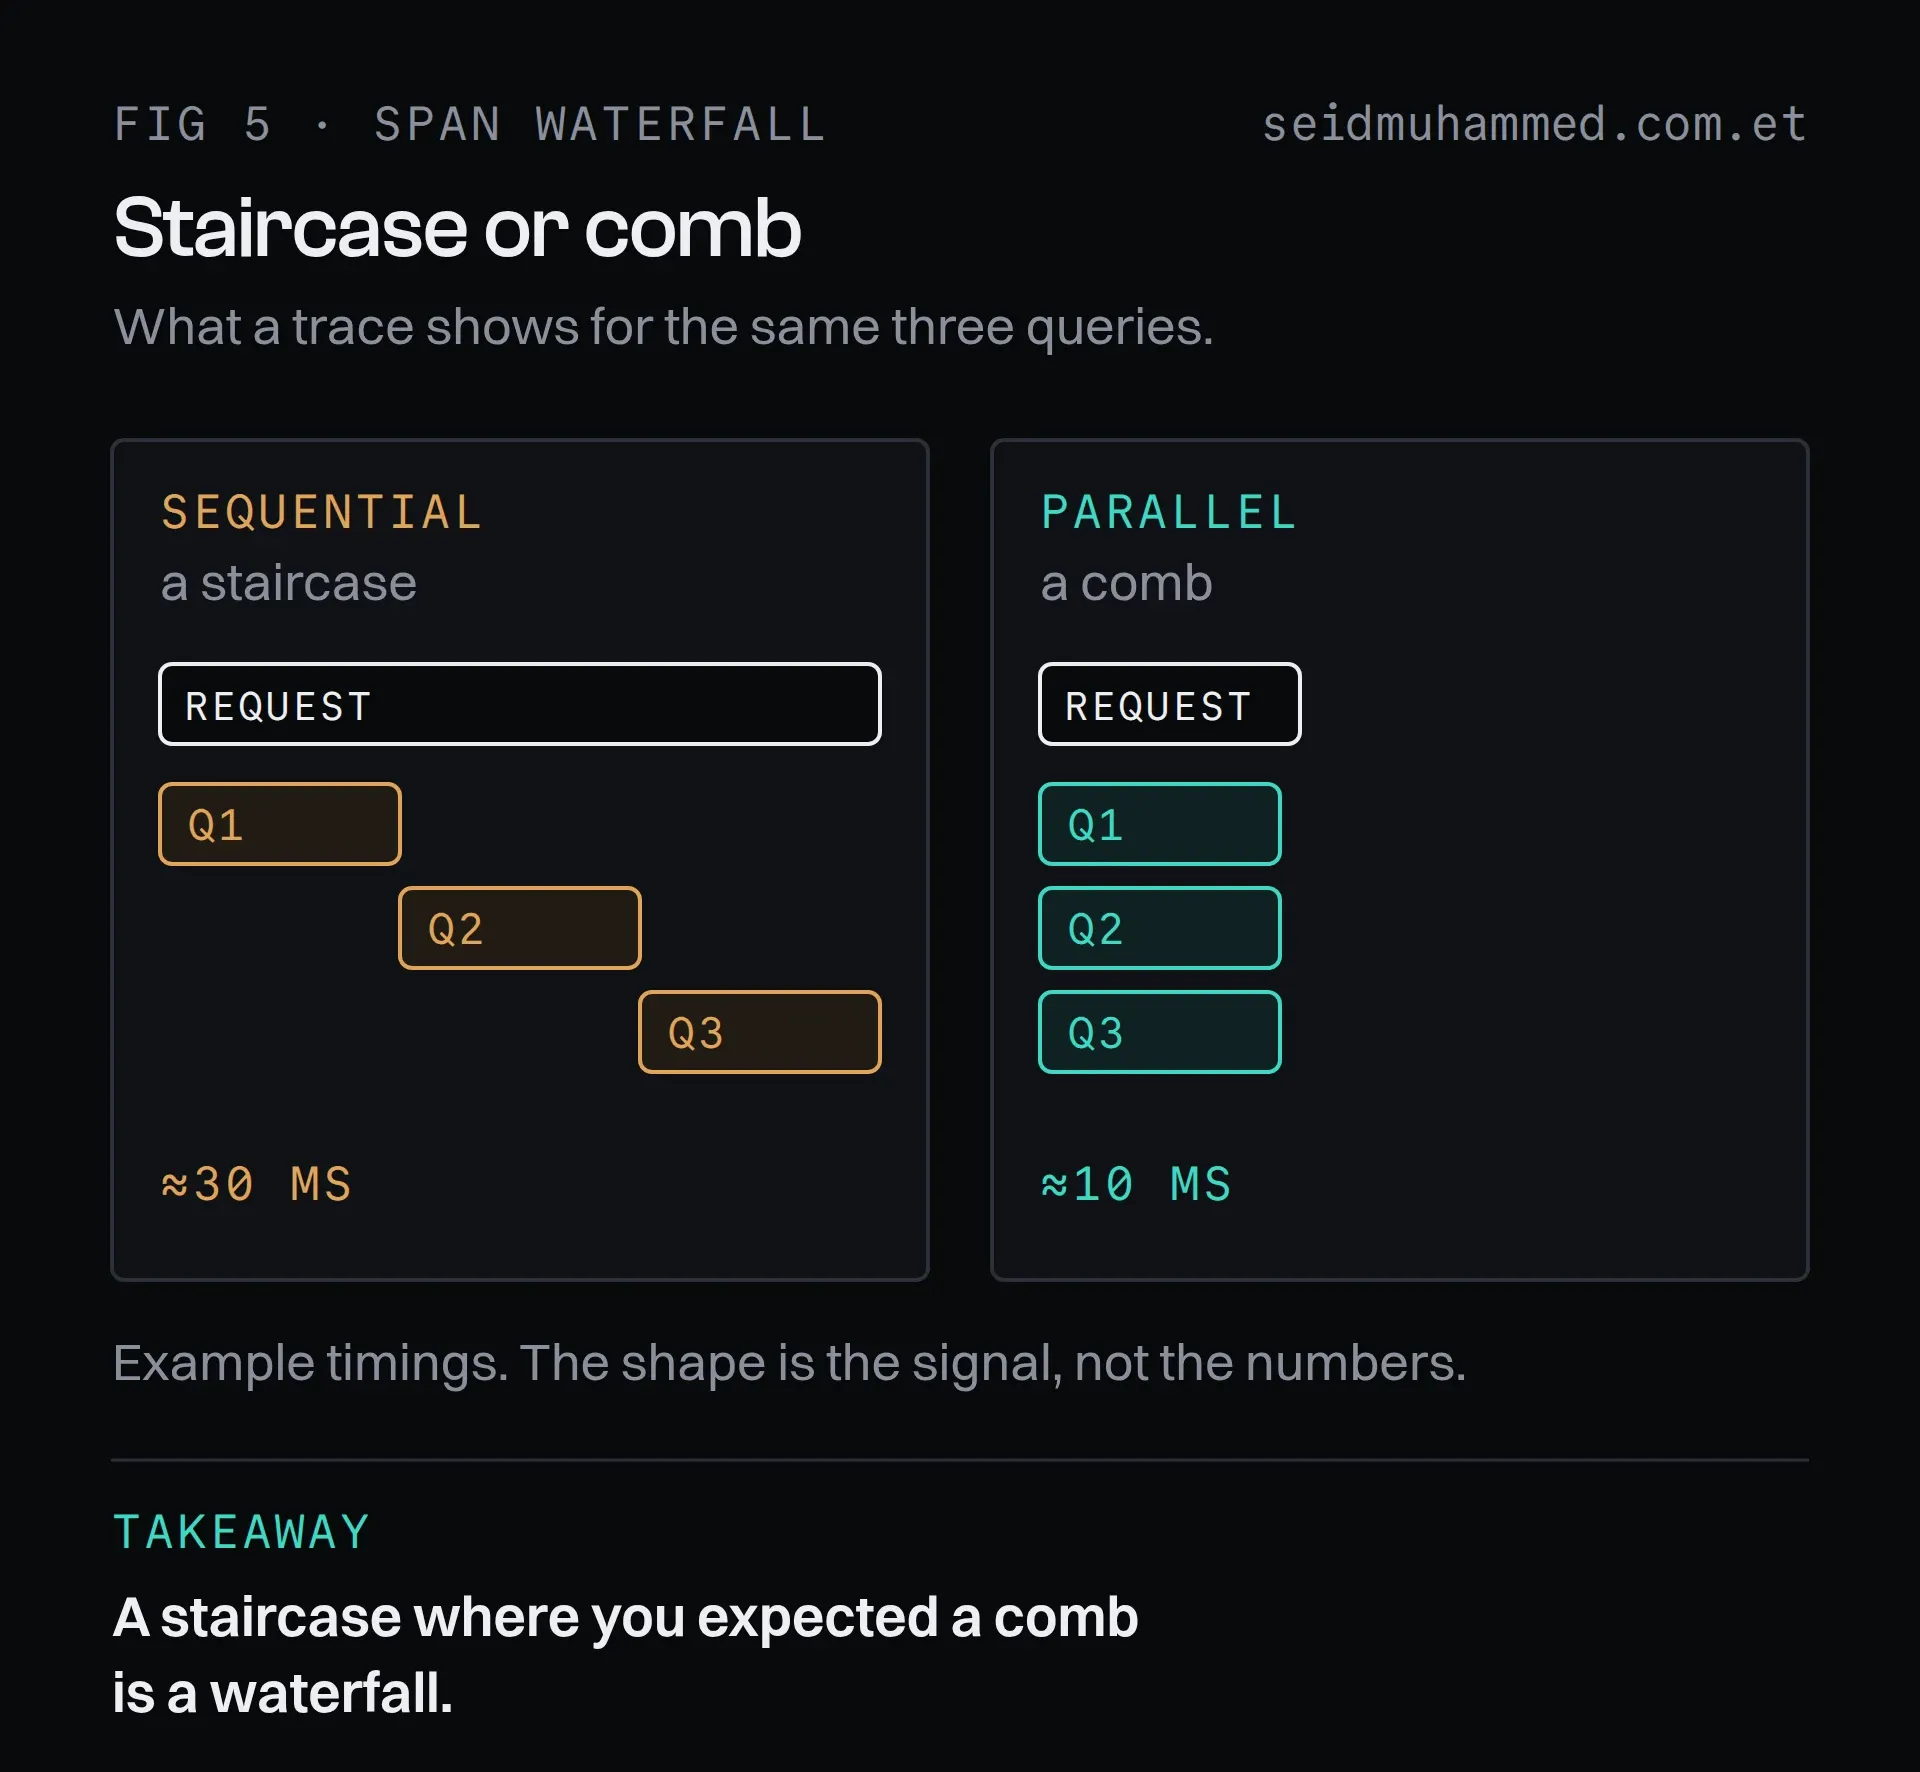
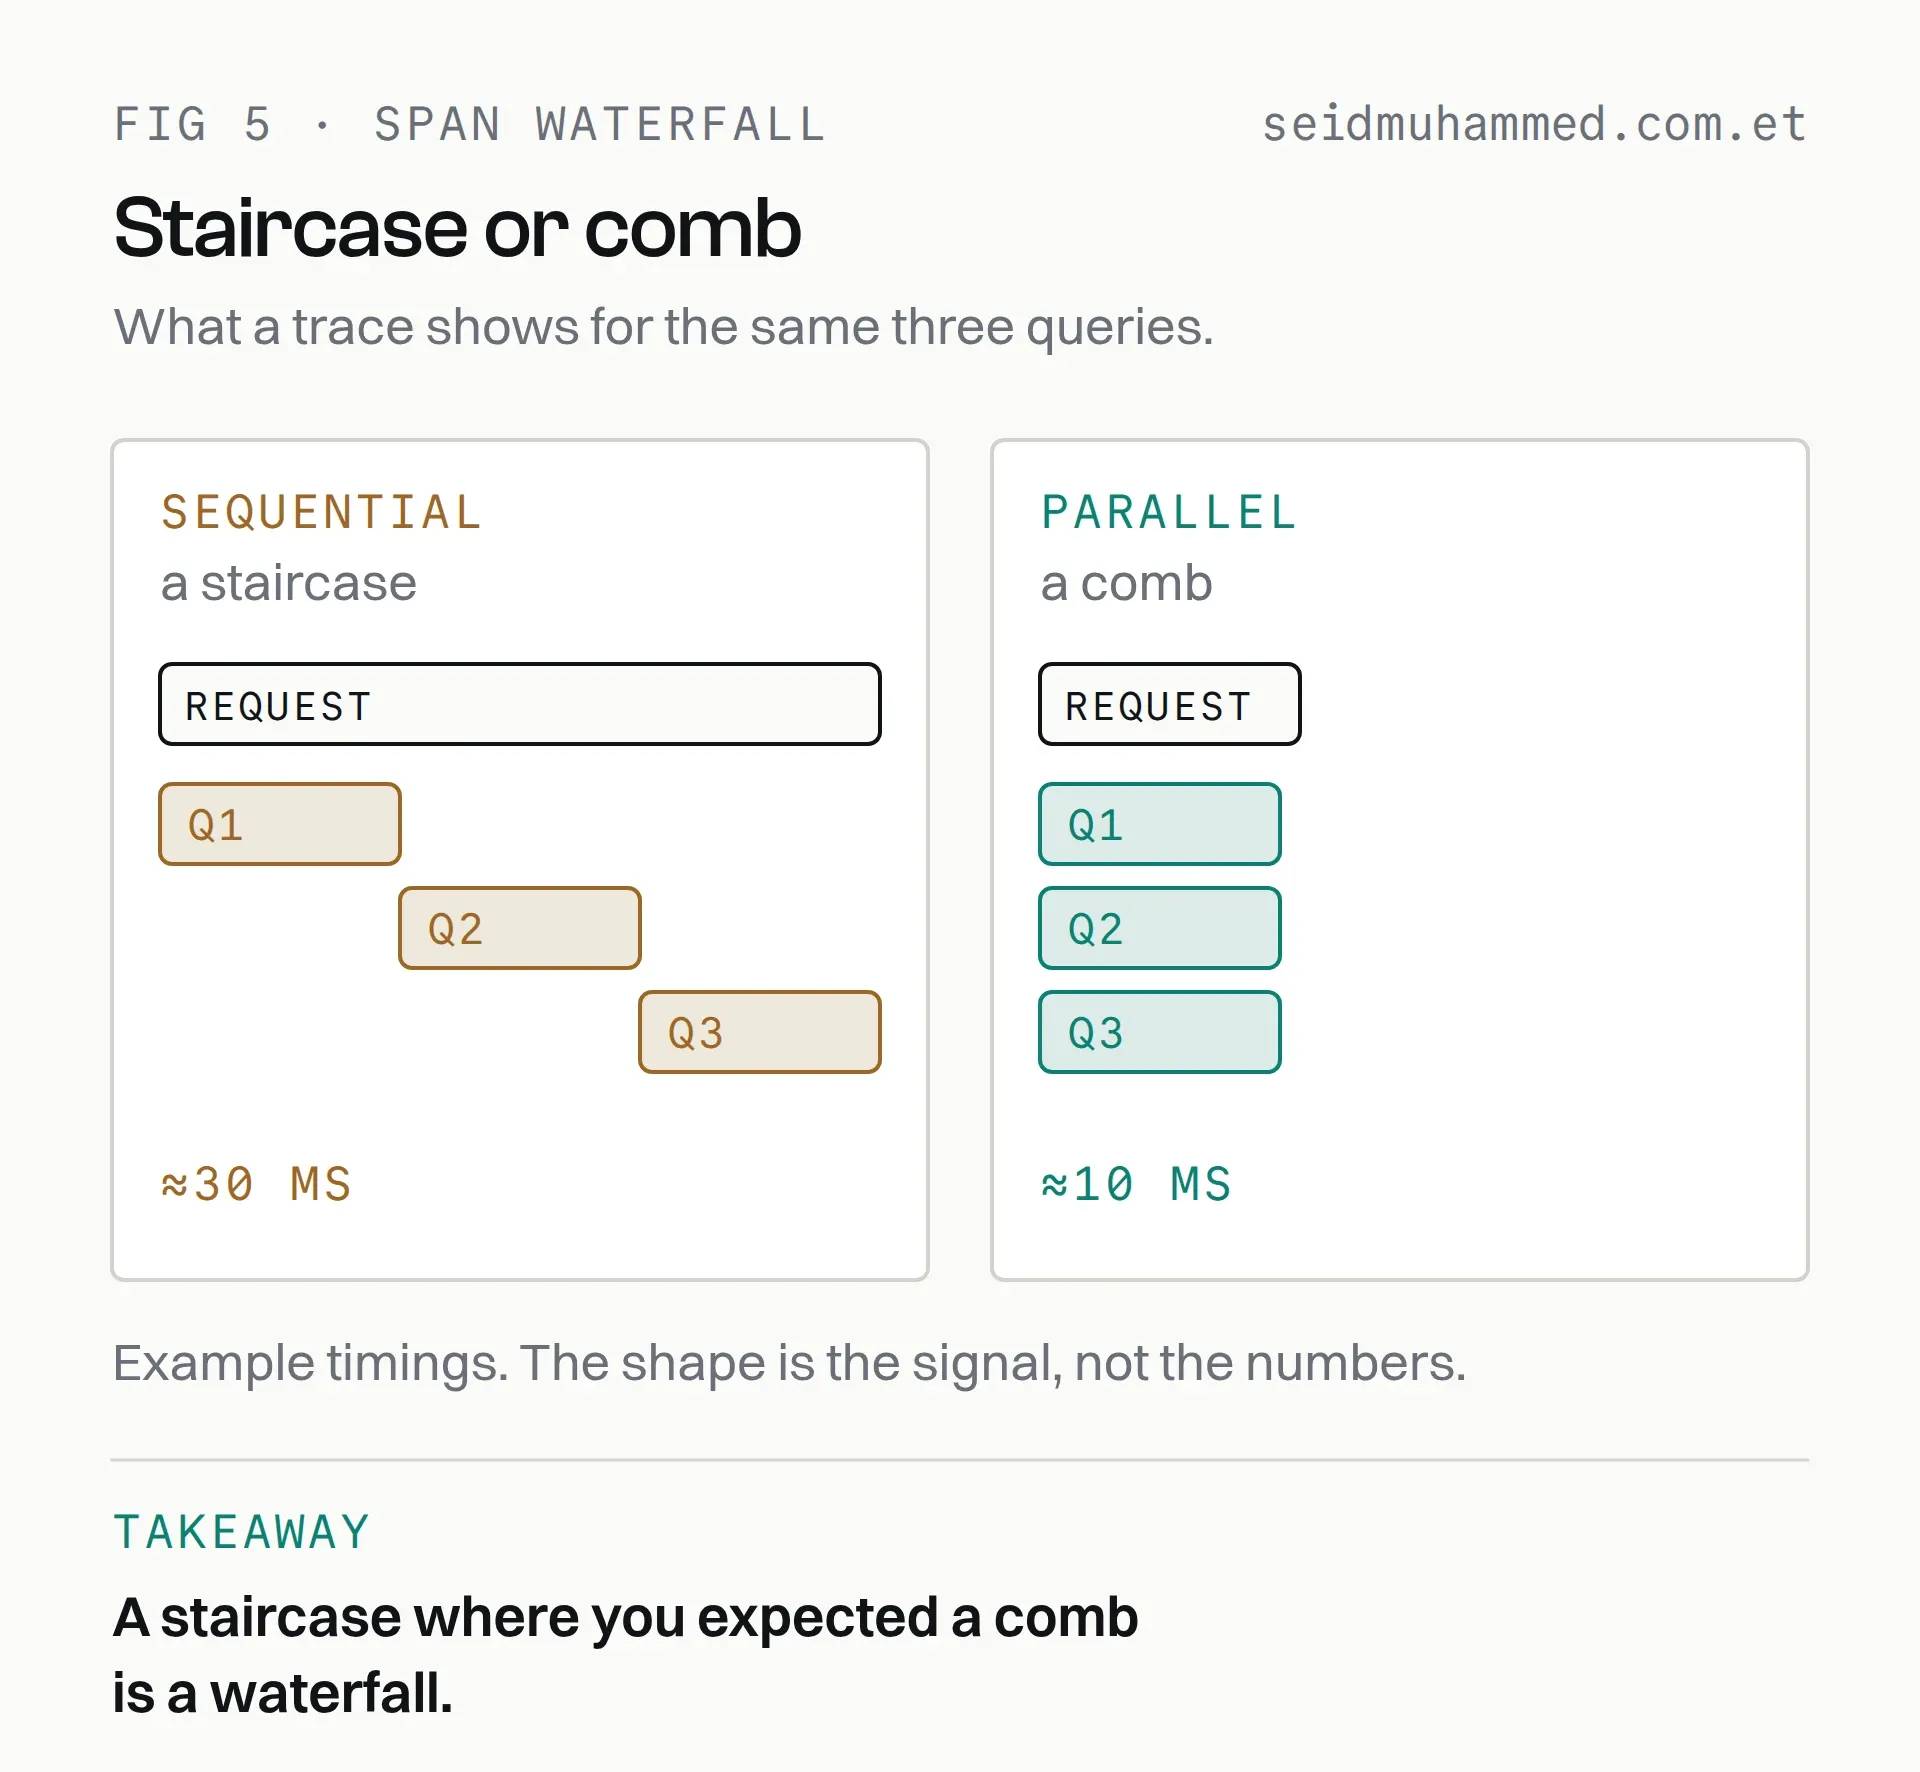
Learn the two shapes once and you can spot a waterfall in a trace viewer at a glance.
The checklist, in order:
- Pick one endpoint. The slowest one by p95, not the one you suspect.
- Do the gap test. Sum the query times your database or ORM reports for one request, then compare with the endpoint's total. Total close to the sum means the queries ran one after another. Total close to the single slowest query means they overlapped.
- If there's no tracing, add a stopwatch for a day. The two-line version is below: call
lap('getUser')after each await. Deltas that step up by roughly one query time each are a staircase. - Read each chained
await. For every call that uses the previous result, check whether the value it reads was already available to the caller. - Fix one, then check the pool. Before widening a fan-out, confirm the connection pool can take it.
const t0 = performance.now()
const lap = (label) => console.log(`${label} +${(performance.now() - t0).toFixed(1)}ms`)
FAQ
Does await block the Node.js event loop?
No. When a function reaches await it suspends and hands control back to the event loop, which keeps serving other requests, timers and I/O. What await does is order your own work: the next line cannot run until the awaited promise settles. Waterfalls cost latency, not event-loop capacity.
How do I run independent async calls in parallel in Node.js?
Start them all before awaiting any of them, usually with Promise.all. Make sure each call only uses values you already have, not fields read off a previous result, or you'll keep a dependency that doesn't need to exist.
When should I use Promise.allSettled instead of Promise.all?
When a partial result is better than an error. Promise.all rejects on the first failure and discards the rest. Promise.allSettled waits for every call and lets you decide per call what is required and what can fall back to an empty value. Pair it with a timeout on each call so one slow dependency can't hold the whole response.
How do I find async/await waterfalls in production?
Compare the database's reported query time with the endpoint's total time. If the gap grows with the number of queries, the calls are running in sequence. A tracing tool shows it as a staircase of spans instead of a comb. Without tracing, log timestamps around each call and read the deltas.
Can running queries in parallel make things slower?
Yes, if they compete for a scarce resource. Ten parallel queries against a pool of five connections just move the queue from your code into the database driver, and the tail latency follows. CPU-bound work doesn't benefit either: it needs a worker thread or a separate process.
Why does p99 get worse faster than the median?
Because slower requests stay resident longer. By Little's Law, tripling residence time at the same arrival rate triples the requests in flight, along with their memory, handles and exposure to slow downstreams. The median barely moves while the tail degrades.
Try it this week
Run the gap test on your slowest endpoint. If the trace is a staircase, you've probably found a two-line diff. If you'd rather have someone go through a service with you, get in touch.
The fix is usually a two-line diff. Finding it is the work.